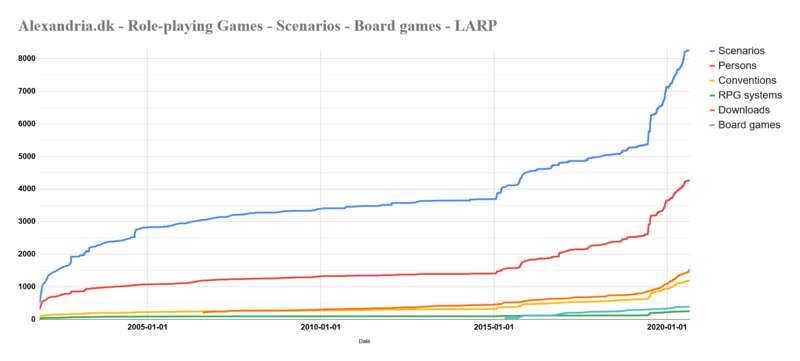
File:Alexandria development chart.png

Size of this preview: 800 × 361 pixels. Other resolutions: 320 × 145 pixels | 1,835 × 829 pixels.
Original file (1,835 × 829 pixels, file size: 82 KB, MIME type: image/png)
Summary
| Description |
English: Graph of content in Alexandria database over time. Raw data is available at Google Sheets: https://docs.google.com/spreadsheets/d/1q9aWrsz7Wh9XW9y8xwyWHzR_RdC8ya31oKCv8kV2kek/edit?usp=sharing |
|---|---|
| Source |
Own work |
| Date |
2020-09-05 |
| Author | |
| Permission (Reusing this file) |
See below.
|
Licensing
I, the copyright holder of this work, hereby publish it under the following license:
|
This file was uploaded with the UploadWizard extension.
File history
Click on a date/time to view the file as it appeared at that time.
| Date/Time | Thumbnail | Dimensions | User | Comment | |
|---|---|---|---|---|---|
| current | 22:24, 5 September 2020 |  | 1,835 × 829 (82 KB) | Penguin (talk | contribs) | User created page with UploadWizard |
You cannot overwrite this file.
File usage
The following page uses this file: